Description
- And vice versa In an uptrend, when the close price is smaller than the bottom of the previous downtrend, the market will switch to a downtrend.
Question 1: How do I specify the Delta markers ▲▼ on the chart via the strategy builder?
→ You can rely on the Signal_Trend to build your own strategy. Here are the values:
- Signal_Trend: 2 = uptrend strong, 1 = uptrend weak, -2 = downtrend strong, -1 = downtrend weak, 0 = neutral
Below is an example condition for your reference:
- If Signal_Trend switches from another value to 2 (Signal_Trend at the current bar equal to 2 and Signal_Trend at 1 bar ago not equal to 2), you can enter LONG here.
- And else, if Signal_Trend switches from another value to -2 (Signal_Trend at the current bar equal to -2 and Signal_Trend at 1 bar ago not equal to -2), you can enter SHORT here.
Question 2: I am noticing that the cumulative delta can remain negative all day, but it can find support and start trending up on negative cumulative delta. It almost never flips from say a threshold of -1,000 to 1000 during the regular trading hours. I do a lot of support and resistance zone fading and the cumulative delta can be -9,000 and the reversal can start an up trend and the cumulative delta remains negative.
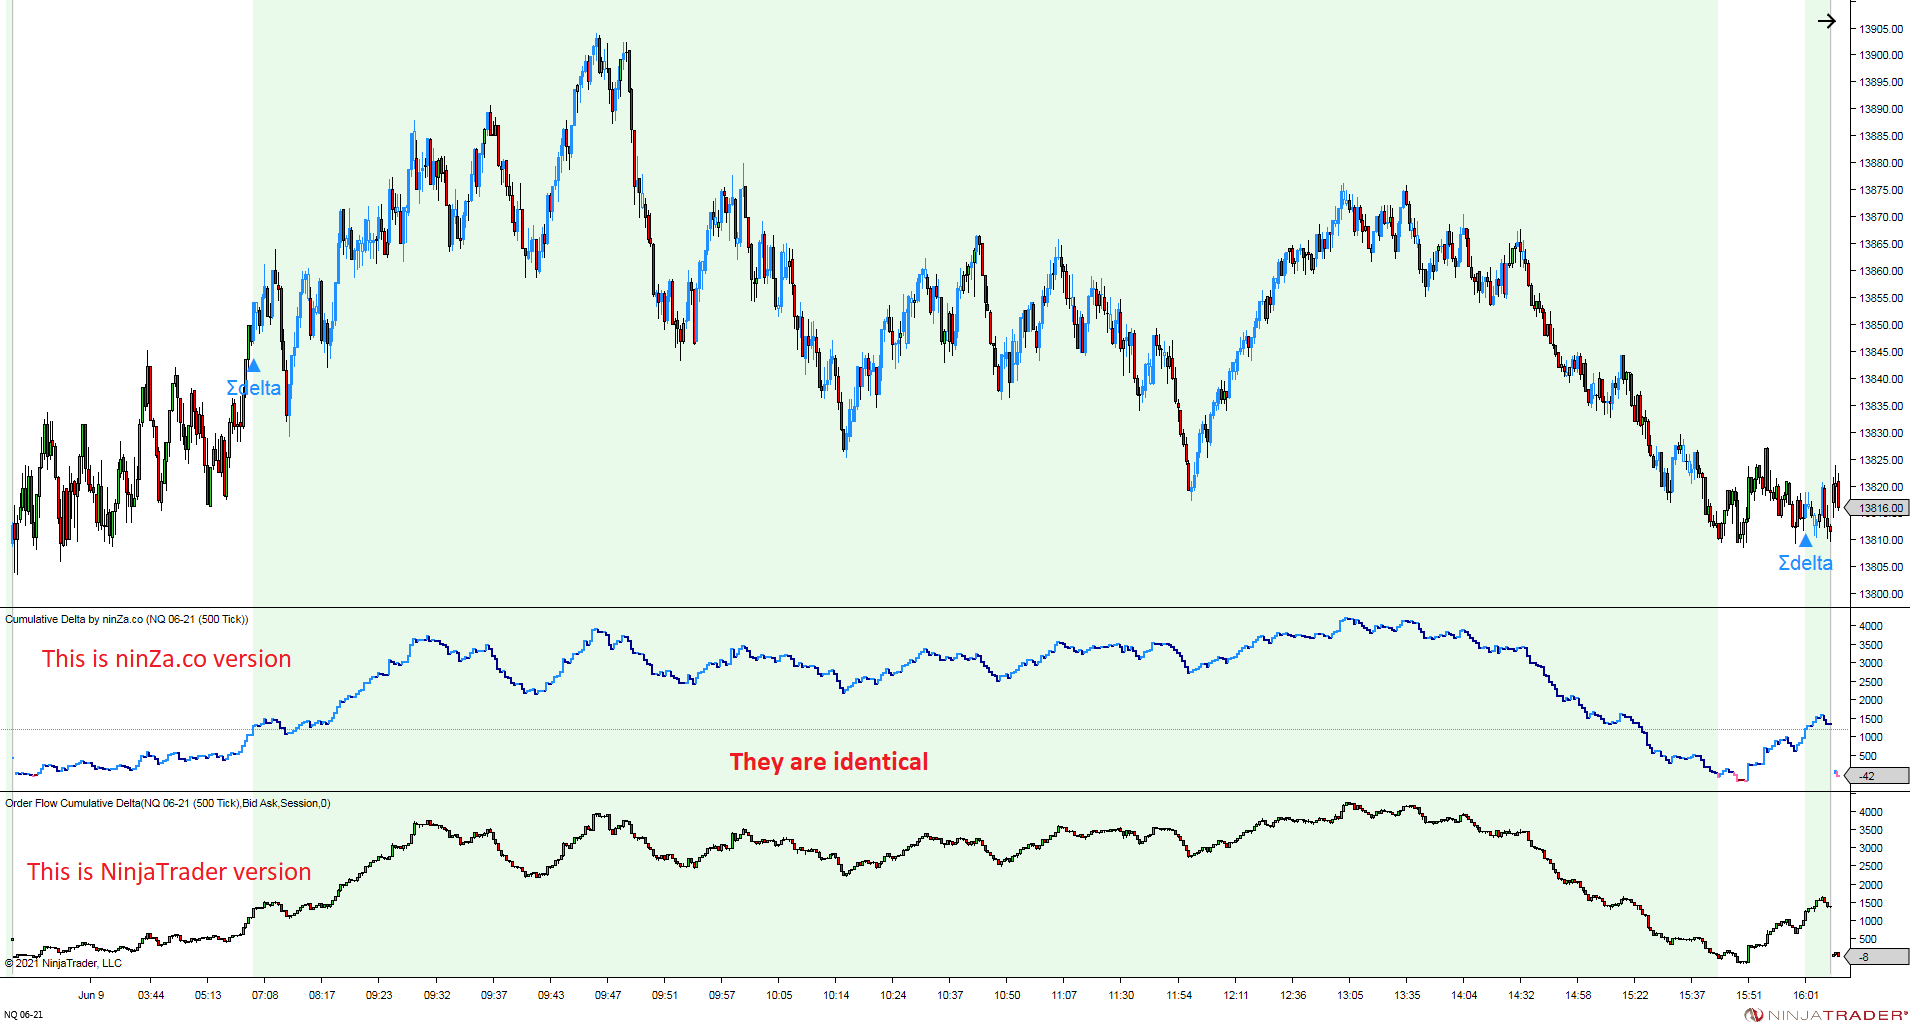
→ Yes, the scenario that you mentioned is possible in reality.
Our indicator just provides raw data of cumulative delta, which is identical to NinjaTrader 8’s Order Flow+ Cumulative Delta indicator. It’s the trader who has to analyze it. (see the attached pictures below)
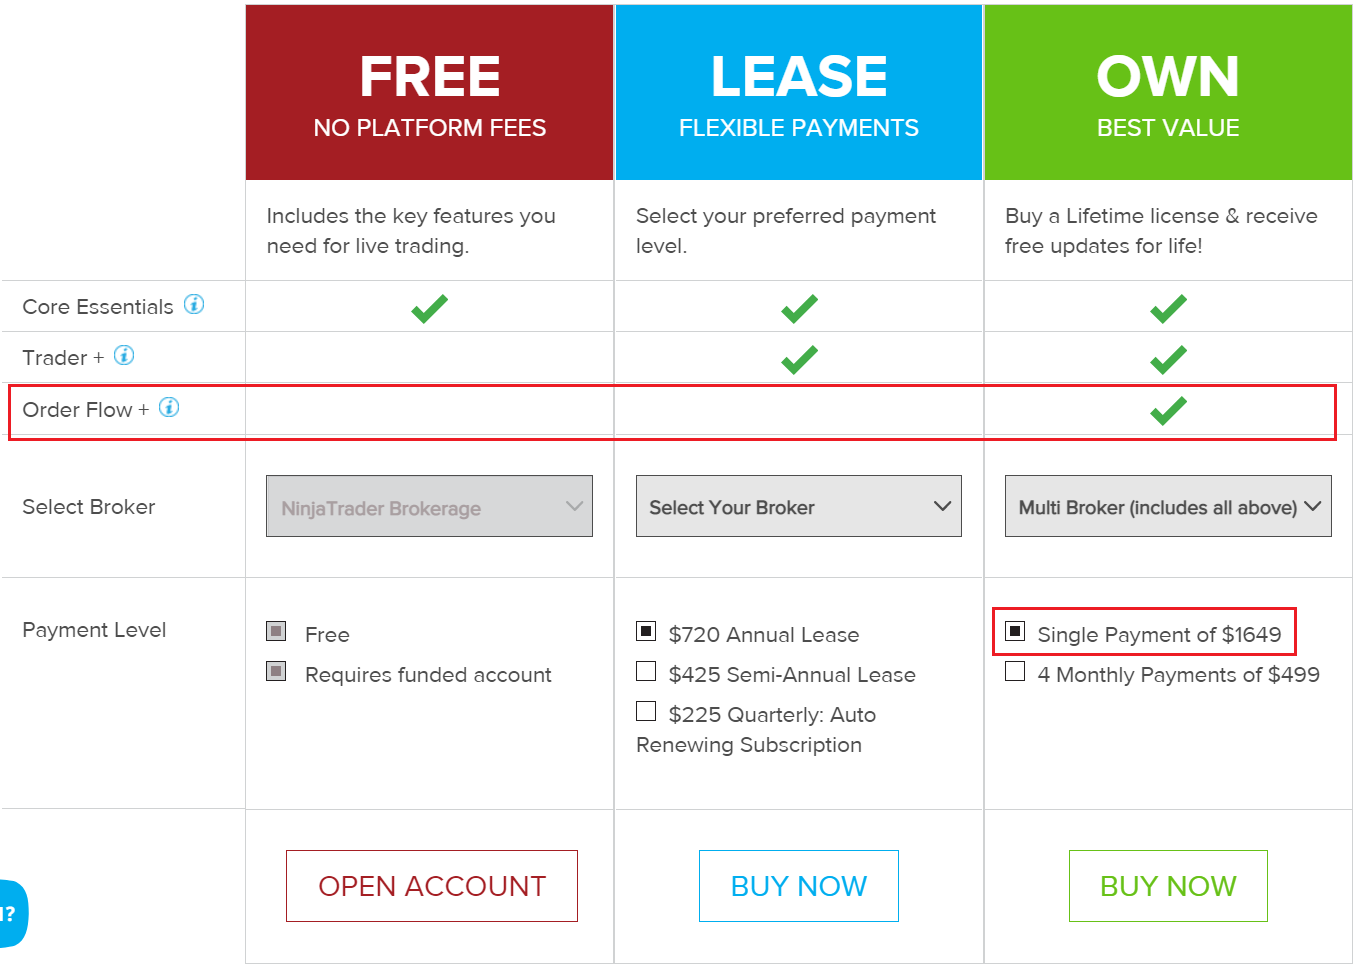
NinjaTrader 8’s Order Flow+ Cumulative Delta indicator has in the OWN version only. (see the attached pictures below or follow the link https://ninjatrader.com/BuyPlatform ) You can see the price of this version is $1649, but with our indicator, you only need to spend $396.
Question 3: I do not show the historical data on the chart?
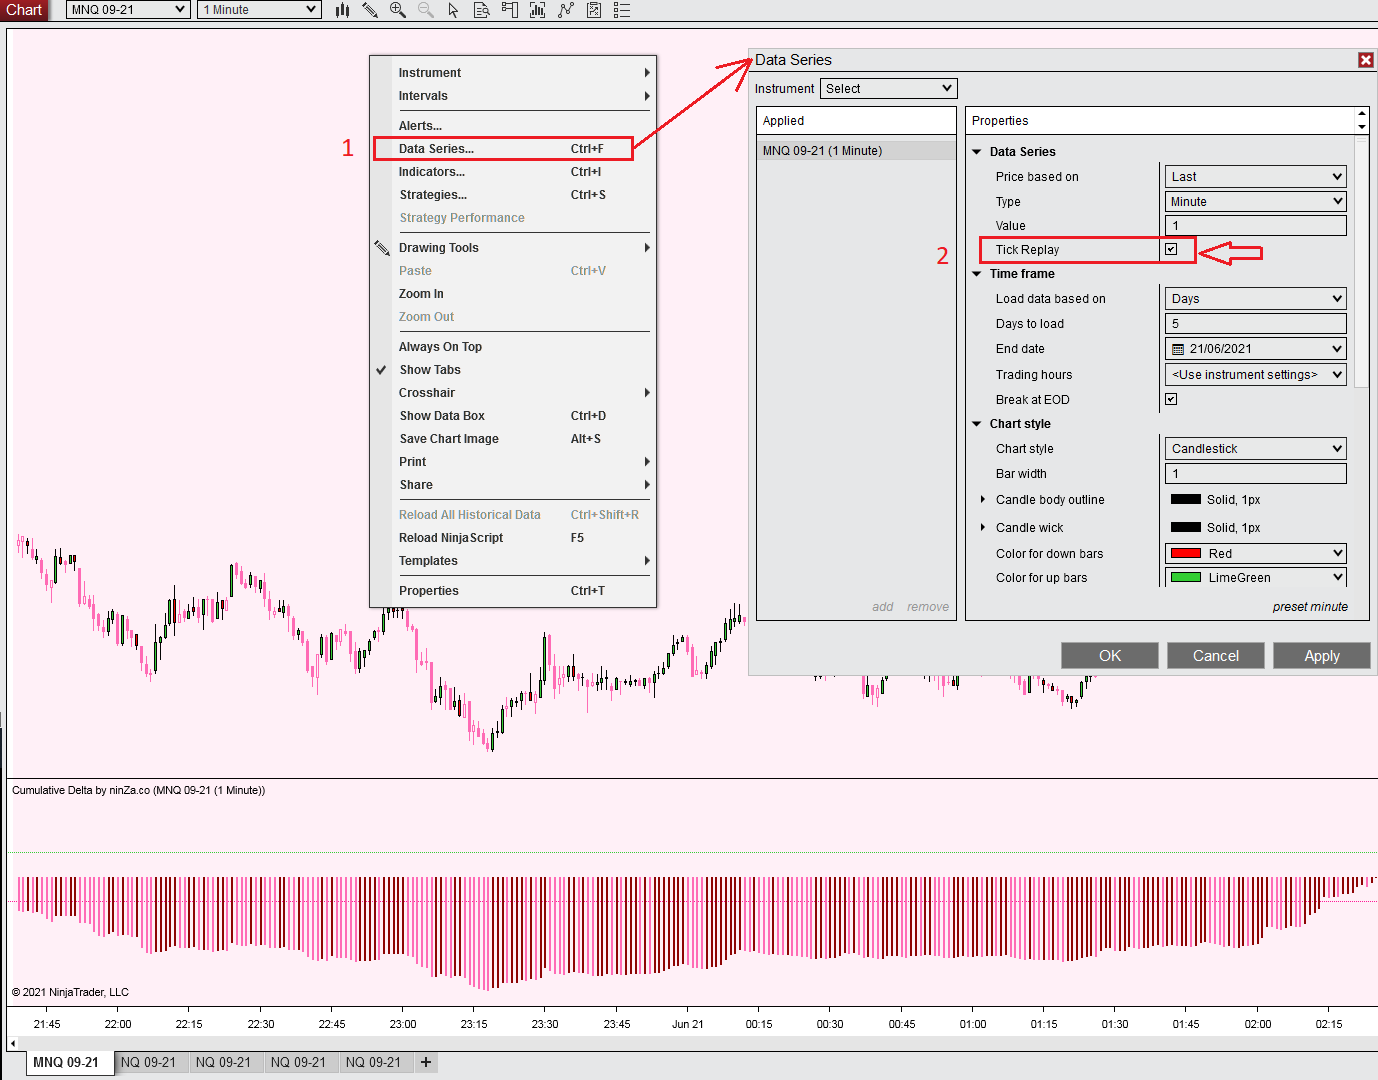
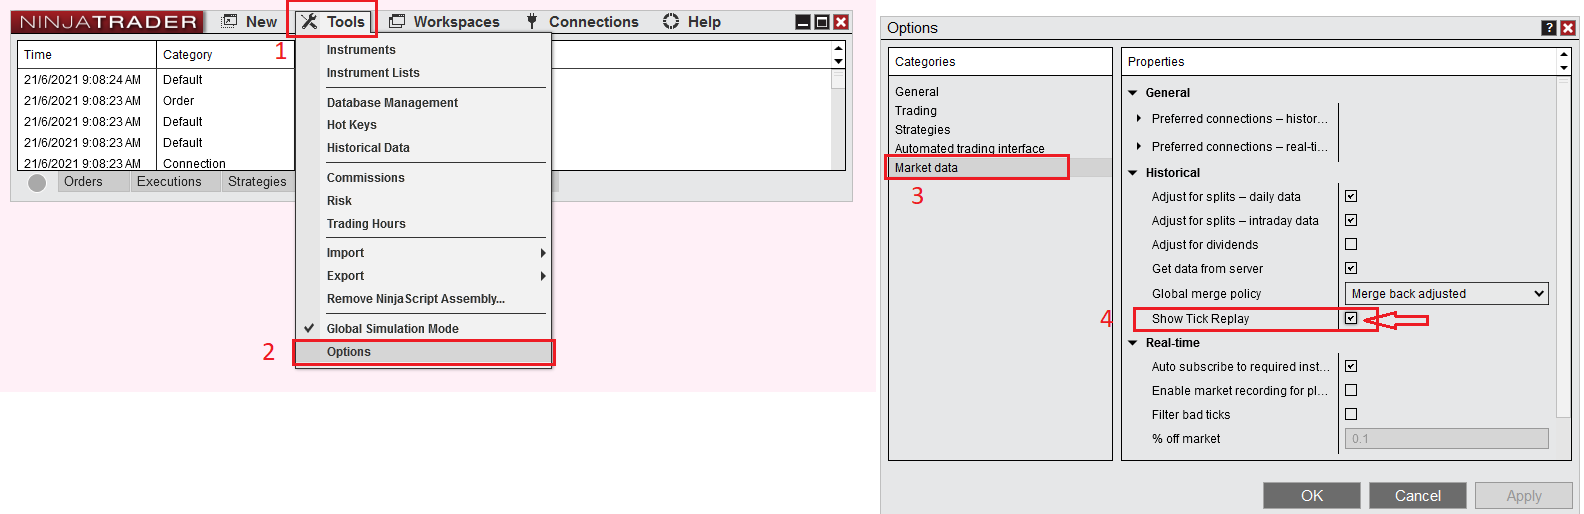
→ To enable Tick Replay on your chart:
Please right-click on your chart, then Select Data Series item. You will see the Data Series dialog ➜ Check the box Tick Replay ➜ Click OK button (see the attached pictures below – Enable Tick Replay.png)
- If you do not see the Tick Replay option, please follow the steps below to enable it: (see the attached pictures below – Show Tick Replay.png)
Go to Tool ➜ Options. You will see the Options dialog ➜ Choose Marker data ➜ Check the box Show Tick Replay ➜ click OK button. (see the attached pictures below – Show Tick Replay.png)
Question 4: There is a line plotted to the chart (not in panel) occasionally but I could not figure out why it pops up yet. Are u aware of this?
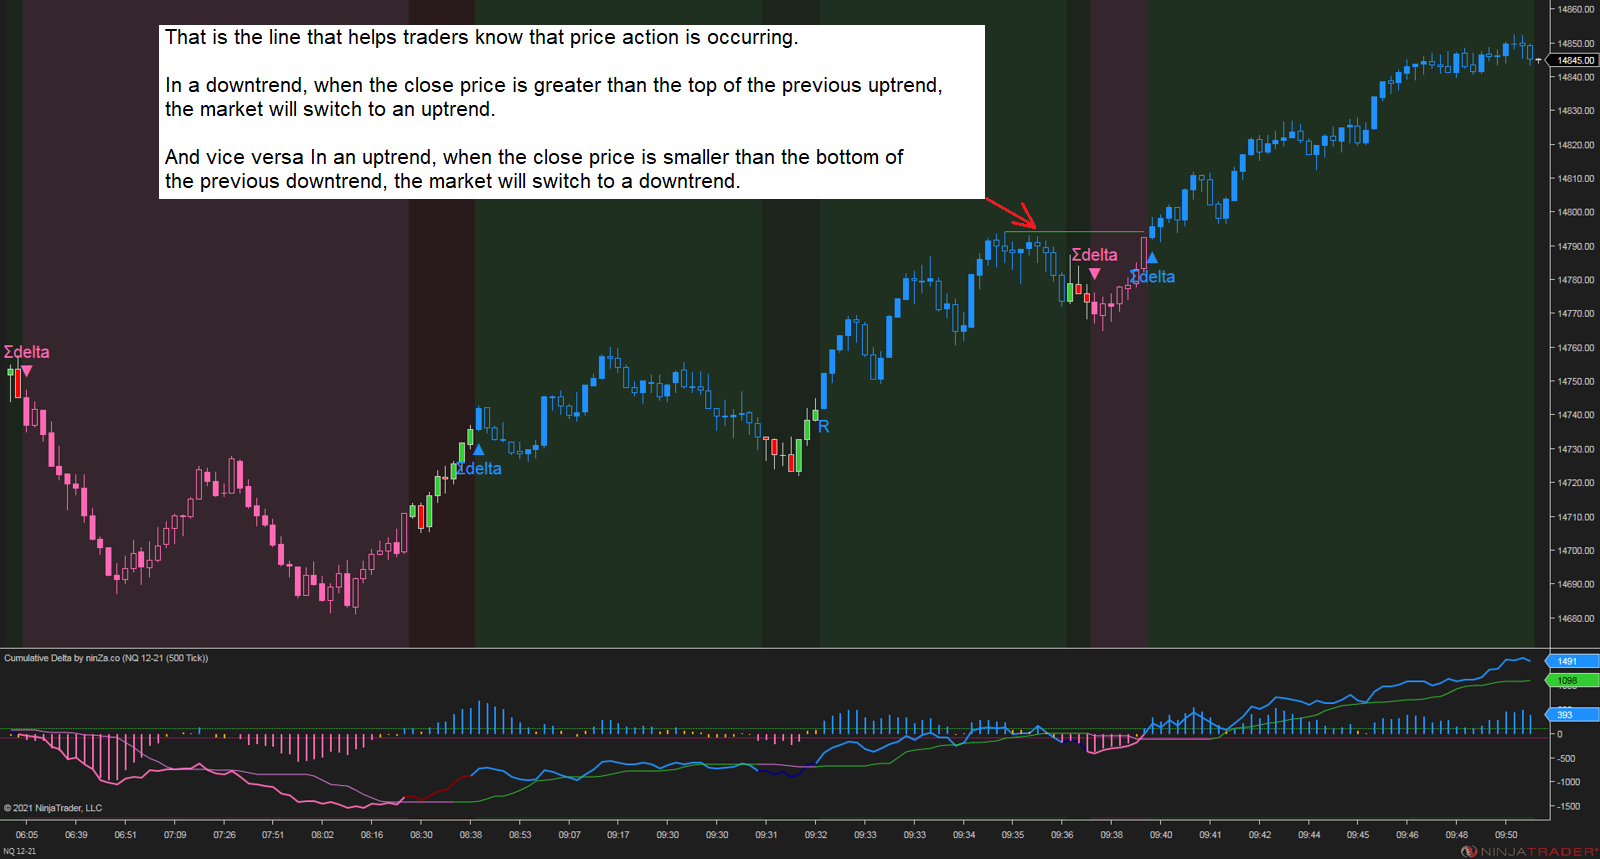
→ That is the line that helps traders know that price action is occurring.
- In a downtrend, when the close price is greater than the top of the previous uptrend, the market will switch to an uptrend.
- And vice versa In an uptrend, when the close price is smaller than the bottom of the previous downtrend, the market will switch to a downtrend.

Reviews
There are no reviews yet.